The National Crime Victimization Survey (NCVS) is a large-scale data collection effort led by the U.S. Census Bureau and the Bureau of Justice Statistics. A nationally-representative sample of approximately 90,000 households is selected, and a survey is administered face-to-face or via telephone twice a year for three years to 160,000 persons within those households who are aged 12 or over. This study has been ongoing since 1973 and is one of the best indicators of crime victimization trends across the United States. It is particularly useful at gathering what us criminologists refer to as “the dark figure of crime” – those offenses that aren’t reported to the police (most commonly sexual assaults and minor thefts).
Measuring School-based Victimization
In 1989, the NCVS added a “School Crime Supplement,” which incorporated additional questions about school-based victimization for 12 to 18 year-olds. This Supplement was included again in 1995 and has been administered every other year since 1999. A single bullying question was utilized in the 1999 version of the survey. It simply asked students if they “had been bullied at school in the last 6 months.” Only 3.6% of students responded that they had. A more comprehensive measure was added in 2005, which asked about experience with seven different behaviors:
• Has another student made fun of you, called you names, or insulted you, in a hurtful way?
• Has another student spread rumors about you or tried to make others dislike you?
• Has another student threatened you with harm?
• Has another student pushed you, shoved you, tripped you, or spit on you?
• Has another student tried to make you do things you did not want to do?
• Has another student excluded you from activities on purpose?
• Has another student destroyed your property on purpose?
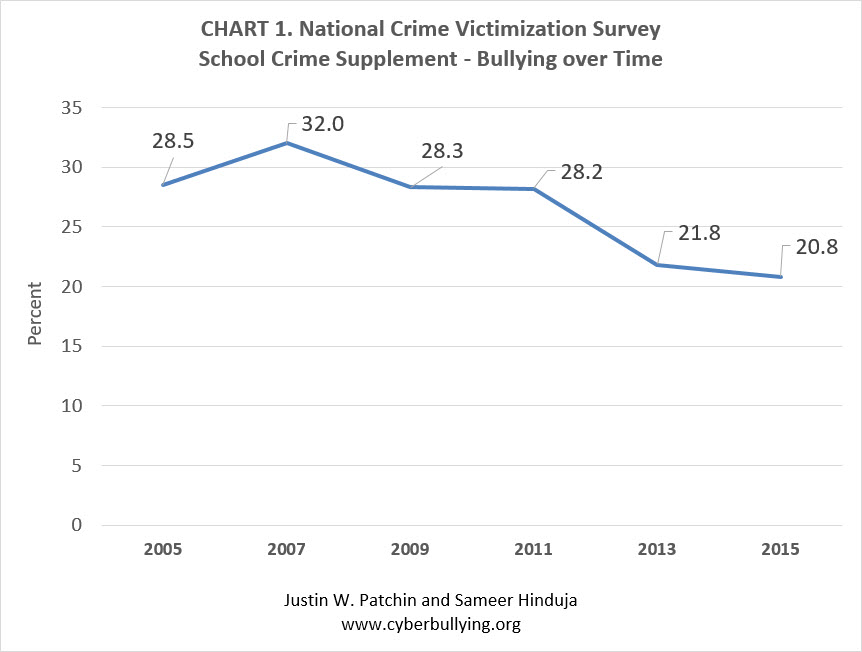
That year, 28.5% of students responded that they had experienced one or more of these events. In 2015, 20.8% of students reported that they had been bullied. Looking back over the last decade, there has been a fairly steady decline in the percent of students who report being bullied at school, based on these seven behaviors (see Chart 1).

New Definition of Bullying
There is debate among researchers, however, about whether the above measure is accurately capturing experiences with “bullying,” or something more akin to what some would call “peer victimization.” It isn’t clear, for example, whether the behaviors occurred repeatedly or if the target lacked power in the situation, two common criteria in most definitions of bullying. In an effort to better understand the nature of these experiences, administrators of the 2015 survey included a new measure of bullying, one based on a uniform definition of bullying established by national experts convened by the Centers for Disease Control and Prevention and U.S. Department of Education in 2014:
“Bullying is any unwanted aggressive behavior(s) by another youth or group of youths who are not siblings or current dating partners that involves an observed or perceived power imbalance and is repeated multiple times or is highly likely to be repeated. Bullying may inflict harm or distress on the targeted youth including physical, psychological, social, or educational harm.” (emphasis added)
Half of the households surveyed in 2015 received a survey that included the questions as they have been asked since 2005. The other half received a different set of questions, based on the above definition. Specifically, in the new version respondents were presented a definition of bullying that included repetition and a power imbalance, and asked if they had been bullied.
“Now I have some questions about bullying at school. Bullying happens when one or more students tease, threaten, spread rumors about, hit, shove, or hurt another student. It is not bullying when students of about the same strength or power argue or fight or tease each other in a friendly way. Bullies are usually stronger, or have more friends or money, or Some other power over the student being bullied. Usually, bullying happens over and over, or the student being bullied thinks it might happen over and over. By this definition, have you been bullied at school by another student this school year?”
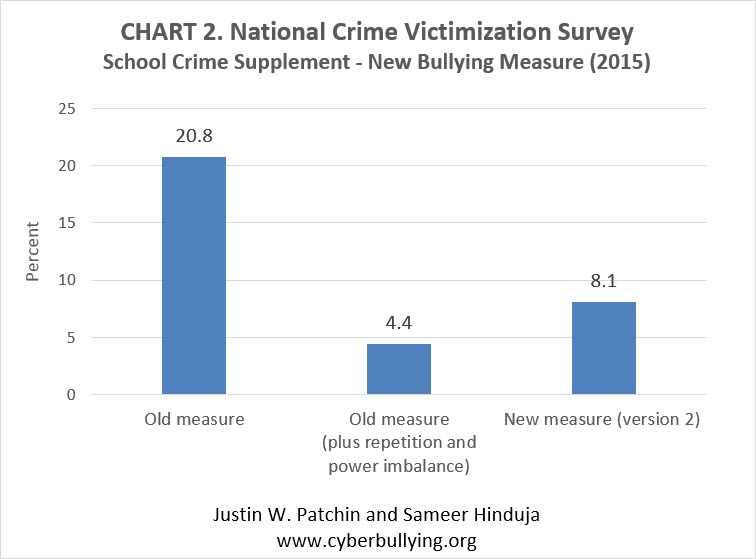
If students responded that they had been bullied, based on this definition, they were asked three follow-up questions to determine if the bullying was verbal, physical, or social. (Curiously, though, they weren’t asked if it occurred online.) Based on this revised method, 8.1% of students were bullied. As a final experiment, new questions were added to a subset of version 1 of the survey (the old way) to find out if the reported behaviors had been experienced repeatedly or with a power imbalance. When this is taken into consideration, only 4.4% of respondents had been bullied. Chart 2 shows the variation in who had been bullied, based on the different definitions.

Conclusions
We can glean a couple of things from the varying ways bullying was operationalized in the 2015 NCVS School Crime Supplement. First, there are many different ways to measure “bullying,” and those will lead to very different reported rates of bullying. This is something we’ve previously written a lot about. For example, in the second edition of Bullying Beyond the Schoolyard, we analyzed 74 papers published in academic journals and found widely disparate definitions of cyberbullying, leading to victimization prevalence rates across samples varying from 2.3% to 72%. (We’ve since updated this analysis to include 134 papers and the rates vary from 0.4% to 92%). If we can’t get all researchers on the same page, then this will continue to be a problem when attempting to compare studies.
Second, relatively few students have been bullied when using the new definition developed by the Centers for Disease Control and Prevention and Department of Education in 2014 (somewhere between 4.4% and 8.1%). What about the other 12-15% who said they were bullied based on the old measure? Does something really need to occur repeatedly, or with an imbalance in power, to be considered bullying? Does extent of harm matter? What about the intent of the person engaged in the behaviors? To be sure, not all hurtful behavior is bullying, but when does it cross the line, and why does all of this even matter?
Finally, researchers now need to decide whether the new method of measuring bullying should be used moving forward. Whether the old questions actually measure bullying or not is subject to intense debate. But it does measure something. And its primary value is the trending it provides. That is, the steady decline in the behaviors between 2005 and 2015 is possibly a signal of something positive happening. I suspect the old and new measures will correlate fairly highly if we view rates based on all three versions across time, but they are vastly different numbers. And the media will likely report whatever number is provided, without much explanation or context. So it is kind of important. I’m hopeful that they will replicate this 2015 methodology in 2017 so we can get a better handle on the implications of the change. Besides, more information is always better. And the more data we can get about the nature and extent of bullying in our schools, the more equipped we will be to confront the problem.
Image: lehman_11 (Flickr)
The post New Bullying Data—and Definition—from the National Crime Victimization Survey appeared first on Cyberbullying Research Center.